(单词翻译:单击)
雅思小作文一向是有一定写作规律可以学习的,尤其是无从下手的时候,依照模板范例学习,可以领会其中的思路。平时多阅读范文,积累专业词汇对于雅思作文分数有很大的帮助。下面来让我们看一看这篇A类组合小作文是如何构成的吧。
You should spend about 20 minutes on this task.
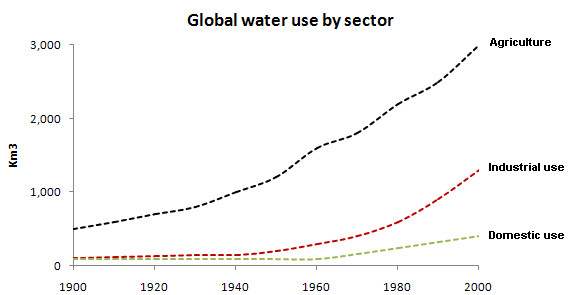
The graph and table below give information about water use worldwide and water consumption in two different countries.
Summarise the information by selecting and reporting the main features, and make comparisons where relevant.
Write at least 150 words.


构思过程:
Introduction - rewrite the question in a different way.
Summary - write one sentence summarising the trend shown on the graph, and one sentence summarising the table.
Details paragraph - describe the graph in detail (maybe 3 sentences).
Details paragraph - describe the table in detail (maybe 3 sentences).
开头:将题目用自己的话表达一遍
总结:写一句话总结图,一句话总结表
第一段:详细描述趋势图
第二段:详细描述表格
model answer:
The graph shows how the amount of water used worldwide changed between 1900 and 2000.
Throughout the century, the largest quantity of water was used for agricultural Purposes, and this increased dramatically from about 500 km³ to around 3,000 km³ in the year 2000. Water used in the industrial and domestic sectors also increased, but consumption was minimal until mid-century. From 1950 onwards, industrial use grew steadily to just over 1,000 km³, while domestic use rose more slowly to only 300 km³, both far below the levels of consumption by agriculture.
The table illustrates the differences in agriculture consumption in some areas of the world by contrasting the amount of irrigated land in Brazil (26,500 km³) with that in the D.R.C. (100 km²). This means that a huge amount of water is used in agriculture in Brazil, and this is reflected in the figures for water consumption per person: 359 m³ compared with only 8 m³ in the Congo. With a population of 176 million, the figures for Brazil indicate how high agriculture water consumption can be in some countries.
(180 words)


