(单词翻译:单击)
剑5 TEST1
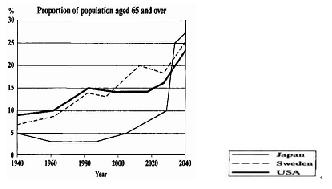
The graph blew shows the proportion of the population aged 65 and over between 1940 and 2040 in three different countries.
Summarise the information by selecting and reporting the main features,and make comparison where relevant.
范文:
The graph shows the increase in the ageing population in Japan, Sweden and the USA. It indicates that the porcentage of elderly people in all three countries is expected to increase to almost 25% of the respective populations by the year 2040.

In 1940 the proportion of people aged 65 or more atood at only 5% in Japan, approximately 7% in Sweden and 9% in the US. However, while the figures for the Western countries grew to about 15% in around 1990,the figure for Japan dippped to only 2.5% for much of this period, before rising to almost 5% again at the present time.
In spite of some fluctuation in the expected percentages, the proportion of older people will probably continue to increase in the next two decades in the three countries. A more dramatic rise is predicted between 2030 and 2040 in Japan, by which time it is thought that the proportion of elderly people will be simliar in the three countries.


