(单词翻译:单击)
写作题目
The chart shows student expenditure over a three-year period in the United Kingdom.
Write a report for a university lecture describing the information shown below.
You should write at least 150 words.
Student expenditure (aged under 26 in higher education) United Kingdom*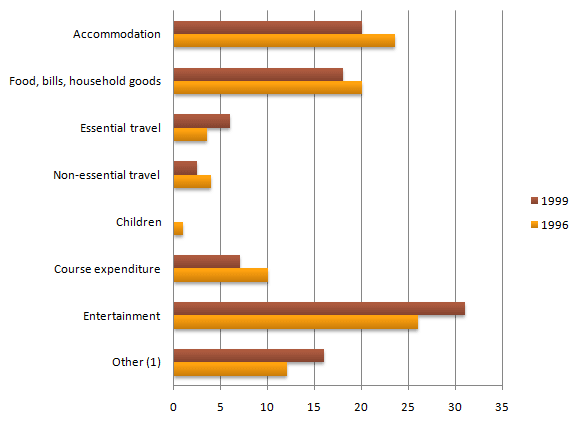
Percentage of total expenditure
(1) includes non-essential consumer items and credit repayments
* Source: Student Income and Expenditure Survey. Department for Education and Employment.
Study these three sentences and then write three similar sentences about other parts of the chart.
1 During the period 1996 to 1999, student spent 3% less onaccommodation, which fell from 23% to 20%of total expenditure.
2 There was a 3% decreasein spending on accommodation, whichfell from 23% to 20%.
3 Spending on accommodationwent down by 3% from 23% to 20%.
参考答案
model answer:
The chart shows the changes which took place in student spending in the United Kingdom during/over the three-year period from 1996 to 1999.
Students spent 3% less on accommodation, which fell from 23% to 20% of total expenditure, and there was a 2% decrease in spending on food, bills and household goods, which fell from 20% to 18%. At the same time course expenditure went down by 3% from 10% to 7%. Children, who constituted 1% of students' expenditure in 1996, are not represented in 1999.
On the other hand, there was a 5% growth in spending on entertainment, which stood at 26% of total expenditure in 1996 but rose to 31% in 1999. Spending on other non-essential items and credit repayments grew by 4% to make up 16% of total expenditure. Spending on essential travel went up by 3% while non-essential travel underwent a 1% fall.
Overall, with the exception of expenditure on travel, the most significant general change was a shift from/in spending on essential items to spending on non-essential items.