(单词翻译:单击)
考试类型: Mathematics > Standard Multiple Choice
Read the following SAT test question and then click on a button to select your answer.

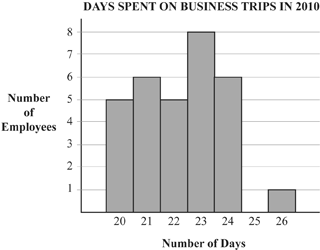
The graph above shows the distribution of the number of days spent on business trips in 2010 by a group of employees of Company W. Based on the graph, what is the median number of days spent on business trips in 2010 for these employees?
A. 22
B. 22.5
C. 22.75
D. 23
E. 23.5
正确答案:A
解析:
Choice (A) is correct. There are 5 + 6 + 5 + 8 + 6 + 1 = 31 employees represented in the graph. If the employees are put in order according to the number of days spent on business trips from least to greatest (or from greatest to least), the median number of days spent on business trips is the number of days spent by the employee in the middle of the list. Since 312 = 15.5, this is the 16th employee (there will be 15 employees before and 15 employees after the 16th employee in a list of 31 employees). From the graph, it can be seen that the 16th employee is in the group that spent 22 days on business trips (since 5 employees spent 20 days on business trips, 6 employees spent 21 days and 5 employees spent 22 days). Therefore, the median number of days spent on business trips in 2010 for these employees is 22.


