(单词翻译:单击)
听力文本
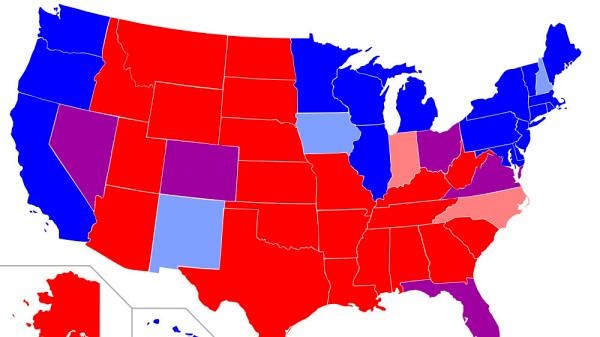
It is commonly portrayed as a polarity that is starkly structured on spatial lines
我们常把分化严重的区域用空间直线来进行划分
With what I sometimes called the map the map of Red and Blue America
从而形成我们所看见的地图,这幅红蓝地图
A map that looks back at 2004, actually very similar to the one in the 2000 election
反应的是2004年的选情与2000年大选的地图十分相似
Showing the states that voted for the Democrat candidate in blue
在地图上,民主党候选人获得选票的州用蓝色表示
Those for the Republican candidate in red
共和党候选人获得选票的则用红色表示
I'm sure you've all seen this
你们之前肯定都已经看过这幅地图
But we see one is with a lot of geographical clumping
我们看到很多地理上的聚集现象
We see a continuous swath of red states
我们看到一大片连续的红色州
And we see the blue states in three different areas
以及分布在不同区域的蓝色州

In the north east, New England and middle Atlantic states
这些州分别分布在东北的新英格兰地区,大西洋沿岸中部地区
and what we may call the upper great lakes and along the pacific coast
以及靠近五大湖区域的右上部和太平洋沿岸
How accurate is this
这幅地图有多精确呢?
Well, this is something that we're going to be spending a lot of time looking at
我们将会花很多时间来仔细地研究这个问题
And trying to figure out just how much this map tells you
思考我们可以从这幅地图得到什么信息
It misses a lot you know it misses the county level
它遗漏了很多信息,例如,你无法从中了解县级的选情
That's something we will go down and we'll look at
这部分内容我们还会再仔细地来探讨
One thing, those who tell us that we are experiencing extreme polarization
那些告诉我们分化情况已经非常严重的人
Is to look at the county level and to look at the number of so called "landslide counties"
都会以县级选举数据中那些"稳赢县"的个数为依据
Counties where one candidate wins by more than 20%
某县级选举中某个候选人赢得超过20%的投票则该县成为"稳赢县"
Back in 1976 only some 27% of U.S counties were landslide counties
1976年时只有大约27%的县是"稳赢县"
In last selection it more like 48%
上次大选中则有48%的县为"稳赢县"
So we've seen a big jump
我们看到这个数字在这些年是在大跃进
But remember this compare that to Ukraine and Bolivia
但你们要记得与乌克兰和玻利维亚相比
That initial Ukraine map actually all of those counties of electoral districts except for one were landslide
尤其是刚才给你们看的那幅乌克兰地图几乎所有县级选区,除了一个之外,都是"稳赢县"
whereas 20 % is not that extreme
相比之下美国的20%则没那么极端
But it is much more extreme than is was as I say 20 years ago,30 years ago or 40 years ago
但现在的分化情况的确比20年前 30年前或40年前要严重
This map is one that, like I say it's deeply penetrated public consciousness
我想这幅地图大家都已非常熟悉
It's interesting to see how it's portrayed as the objects of a lot of parity
我们来看看它是怎么被描述的也许更有趣,每个图标都有其对应的含义
Yes, one fish, two fish, red state, blues state
一条鱼,两条鱼,红色州,蓝色州
I thought it is interesting that California is much large than Texas in that map
我觉得这里一件很有意思的事情是加州居然被画得比德州大那么多
May tell you something about the person who made it
你大概可以由此猜测出画这幅图的是谁
视频及简介
本课程结合大量地图,探索了美国总统大选(包括过去和现在)中的地理学,并且对仅仅简单把美国分为红州(共和党)和蓝州(民主党)这一说法提出挑战。现实中,美国社会两党的情况,远比这种简单的两分法要复杂。


